

Bitcoin - Is halving priced in or another leg up? #4May
Bitcoin - Is halving priced in or another leg up? #4May
The top is in according to TD sequential indicator, long term resistance line being tested, weekly MACD telling a different story

Good morning folks! A new week has started and we can already see some selling pressure. In our previous post, we had mentioned that if Bitcoin can overcome the $8200 resistance we can see some real bullish action-that was spot on and we saw Bitcoin’s rally till $9400. Now at the beginning of this week, we have some clear price levels to watch out for, so make sure you read the full article to comprehend them.
Price level overview for today
> $9300: We should see $10400(the next resistance level according to TD9 indicator)
$8800-$8600: No trade zone as the price can move in any direction
$8300: Strong resistance zone (Fractal analysis & EMA50)
$7800: Long term support line, breaking of which will take us to $6800(3 point reversal bottom target - see the previous post)
TD sequential indicator - Indicating top
After the April 29th rally, Bitcoin has tried to overcome the $9200 resistance twice. However, with the failure of both the attempts, us traders should question whether this pre-halving rally is exhausted or not. When it comes to identifying uptrend or downtrend exhaustion, TD sequential indicator comes in very handy(Tone Vays made it popular in the crypto space).
So how to use this number indicator? TD 9 indicator is used to identify a price point where an uptrend or a downtrend exhausts itself and reverses. It gives you an idea of where to buy and where to sell. To identify a sell setup you have to look for 9 consecutive closes “higher” than the close 4 candles prior. An ideal sell is when the high of bars 6 and 7 in the count is exceeded by the high of bars 8 or 9.
You can see it in action from the tweet below, where Bitcoin printed the TD 9th candle on May 1st indicating uptrend exhaustion. If we can close above $9200, this set up will be invalidated and we can then target the next resistance at $10400, else we are looking for a $7800 retest.


Long term resistance being tested
One of the many reasons the $9400 rejection happened was because of Bitcoin’s long-term resistance line dating back to 2017 top. This resistance has been tested multiple times in the past couple of years and soon after hitting it Bitcoin saw a $1000 pullback. If we can break this resistance then the sky is the limit but for that to happen we need a lot more volume. In other words, $9400 might be the local top before halving.


Green MACD to the rescue
Now, to infuse some more hopium, we have a bullish MACD cut on the weekly. The last couple of times it happened we saw a huge rise in price. Will we be the third time lucky? Only time can tell, till then keep a close watch on the weekly MACD.


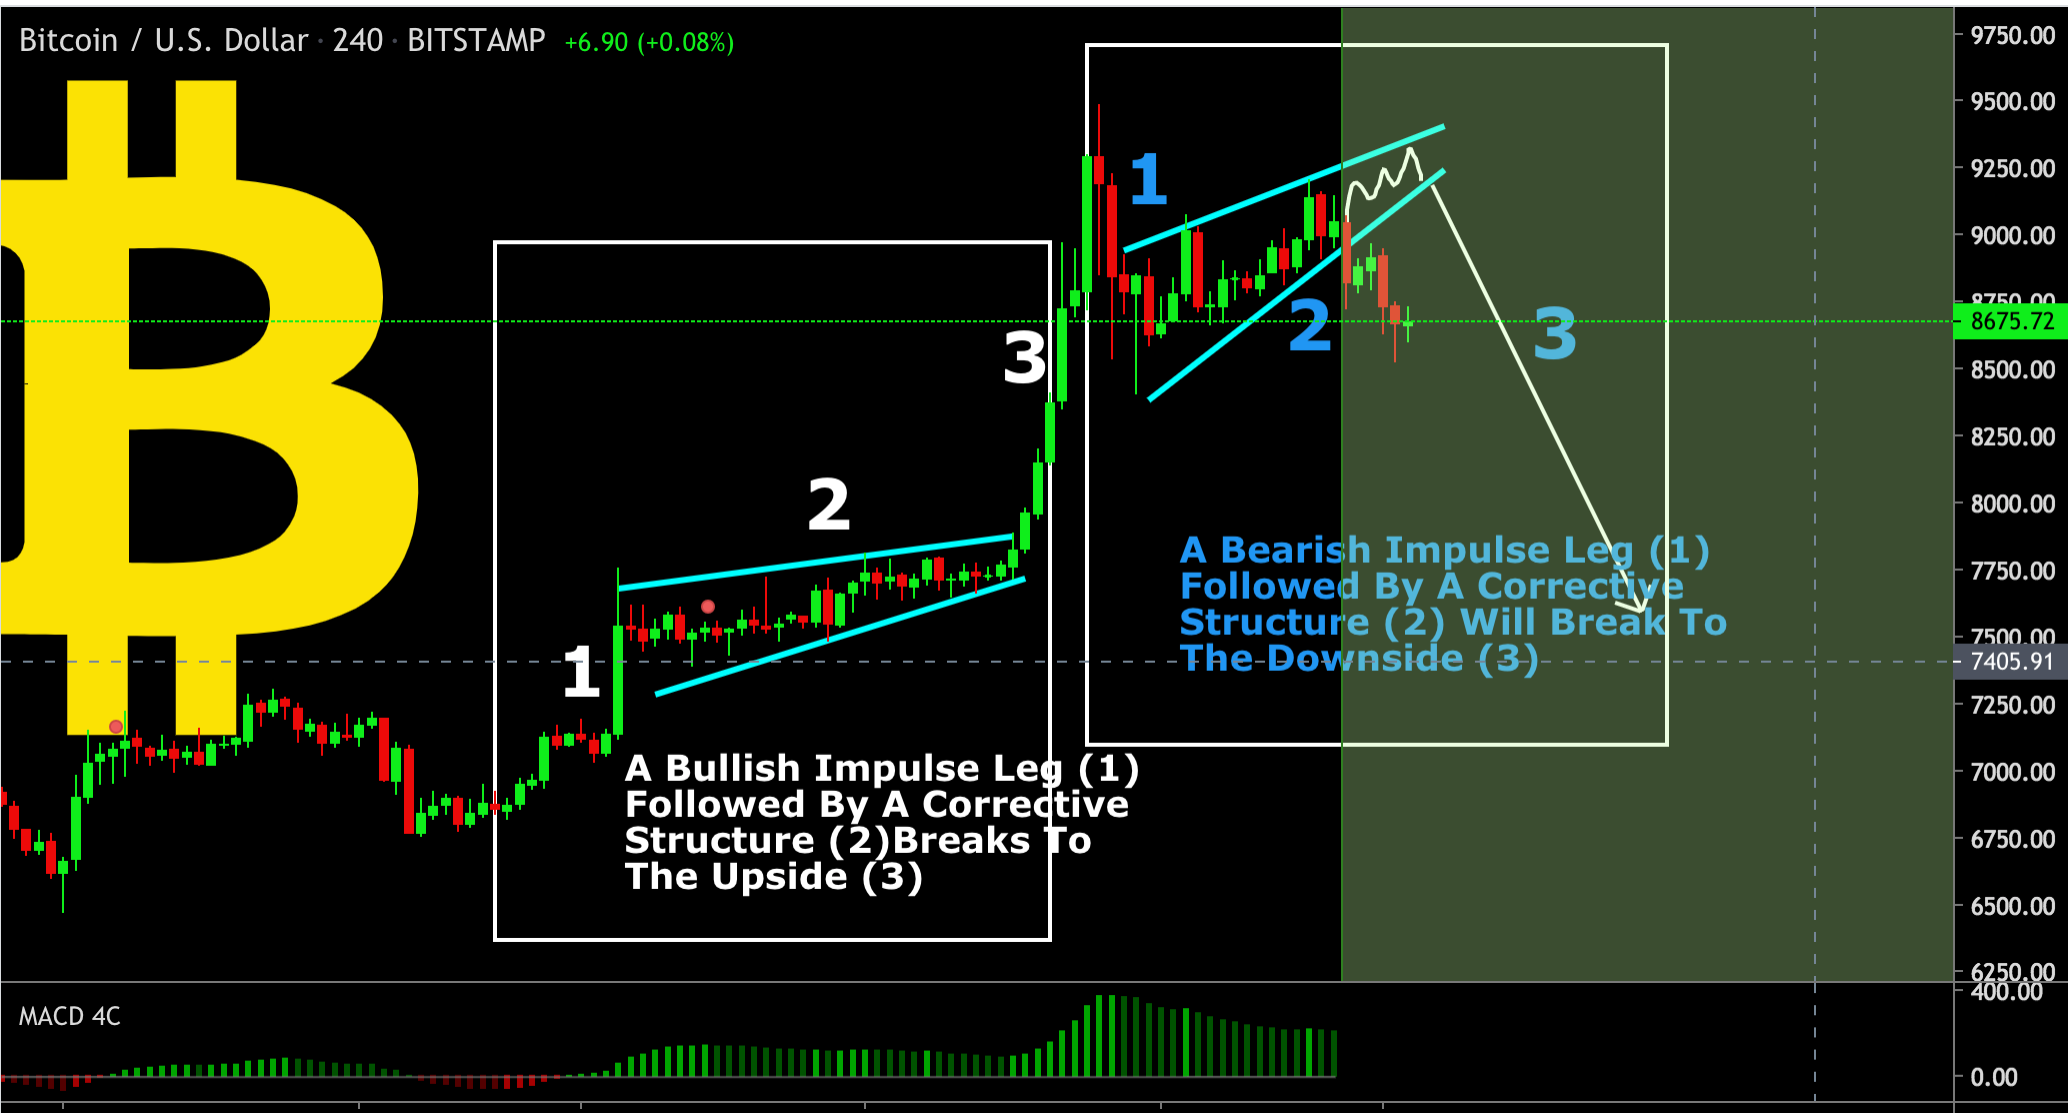
Or will the price tumble down?
We are currently in a corrective structure and have a high chance of breaking to the downside because the corrective structure is preceded by a bearish impulse leg. A closer look at the first box will unveil the opposite scenario, where we had a bullish impulse leg followed by a corrective structure that was broken to the upside. According to the chart below, the market will likely crawl up some more, and the bigger the correction the bigger the drop that's coming.
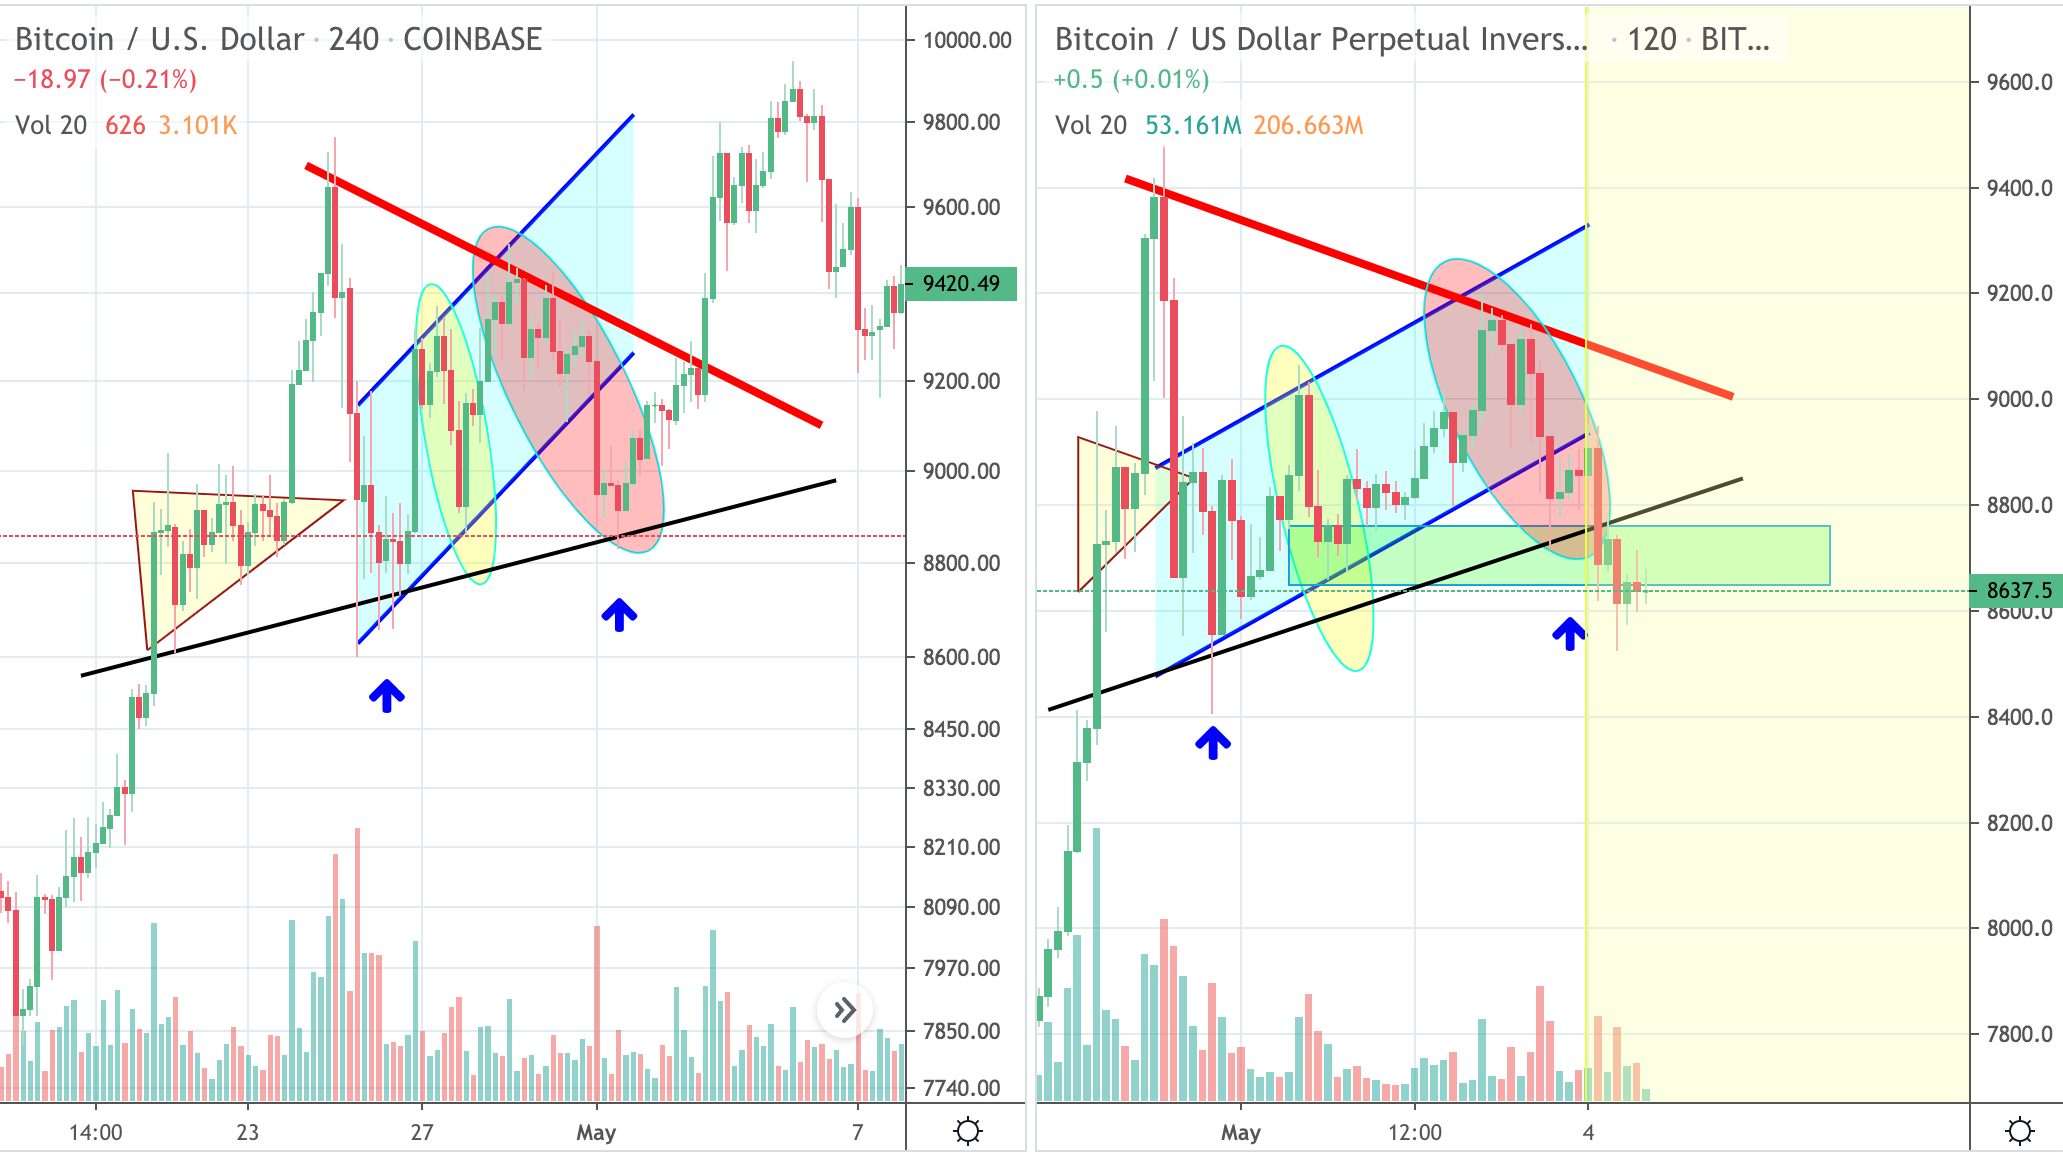
Fractal identified between 2018 April-May and 2020 April-May
An identical fractal has been identified between 2018 April-May and 2020 April-May. Assuming it's identical, then the top point for this rally should be around 9250. Hence if it gets above like 9300ish, the fractal analysis will be nullified.
So if the suggested fractals are similar in nature then another retest of $8600 or $8800 will happen(which is where we are trading now). If it follows the same pattern, it should make a drop below $8300 where it should trigger a bearish signal, to lure in shorts again.
https://www.tradingview.com/chart/BTCUSD/zh6ZdyeM-Bitcoin-April-2018-Fractal-Great-Road-Map-so-Far/
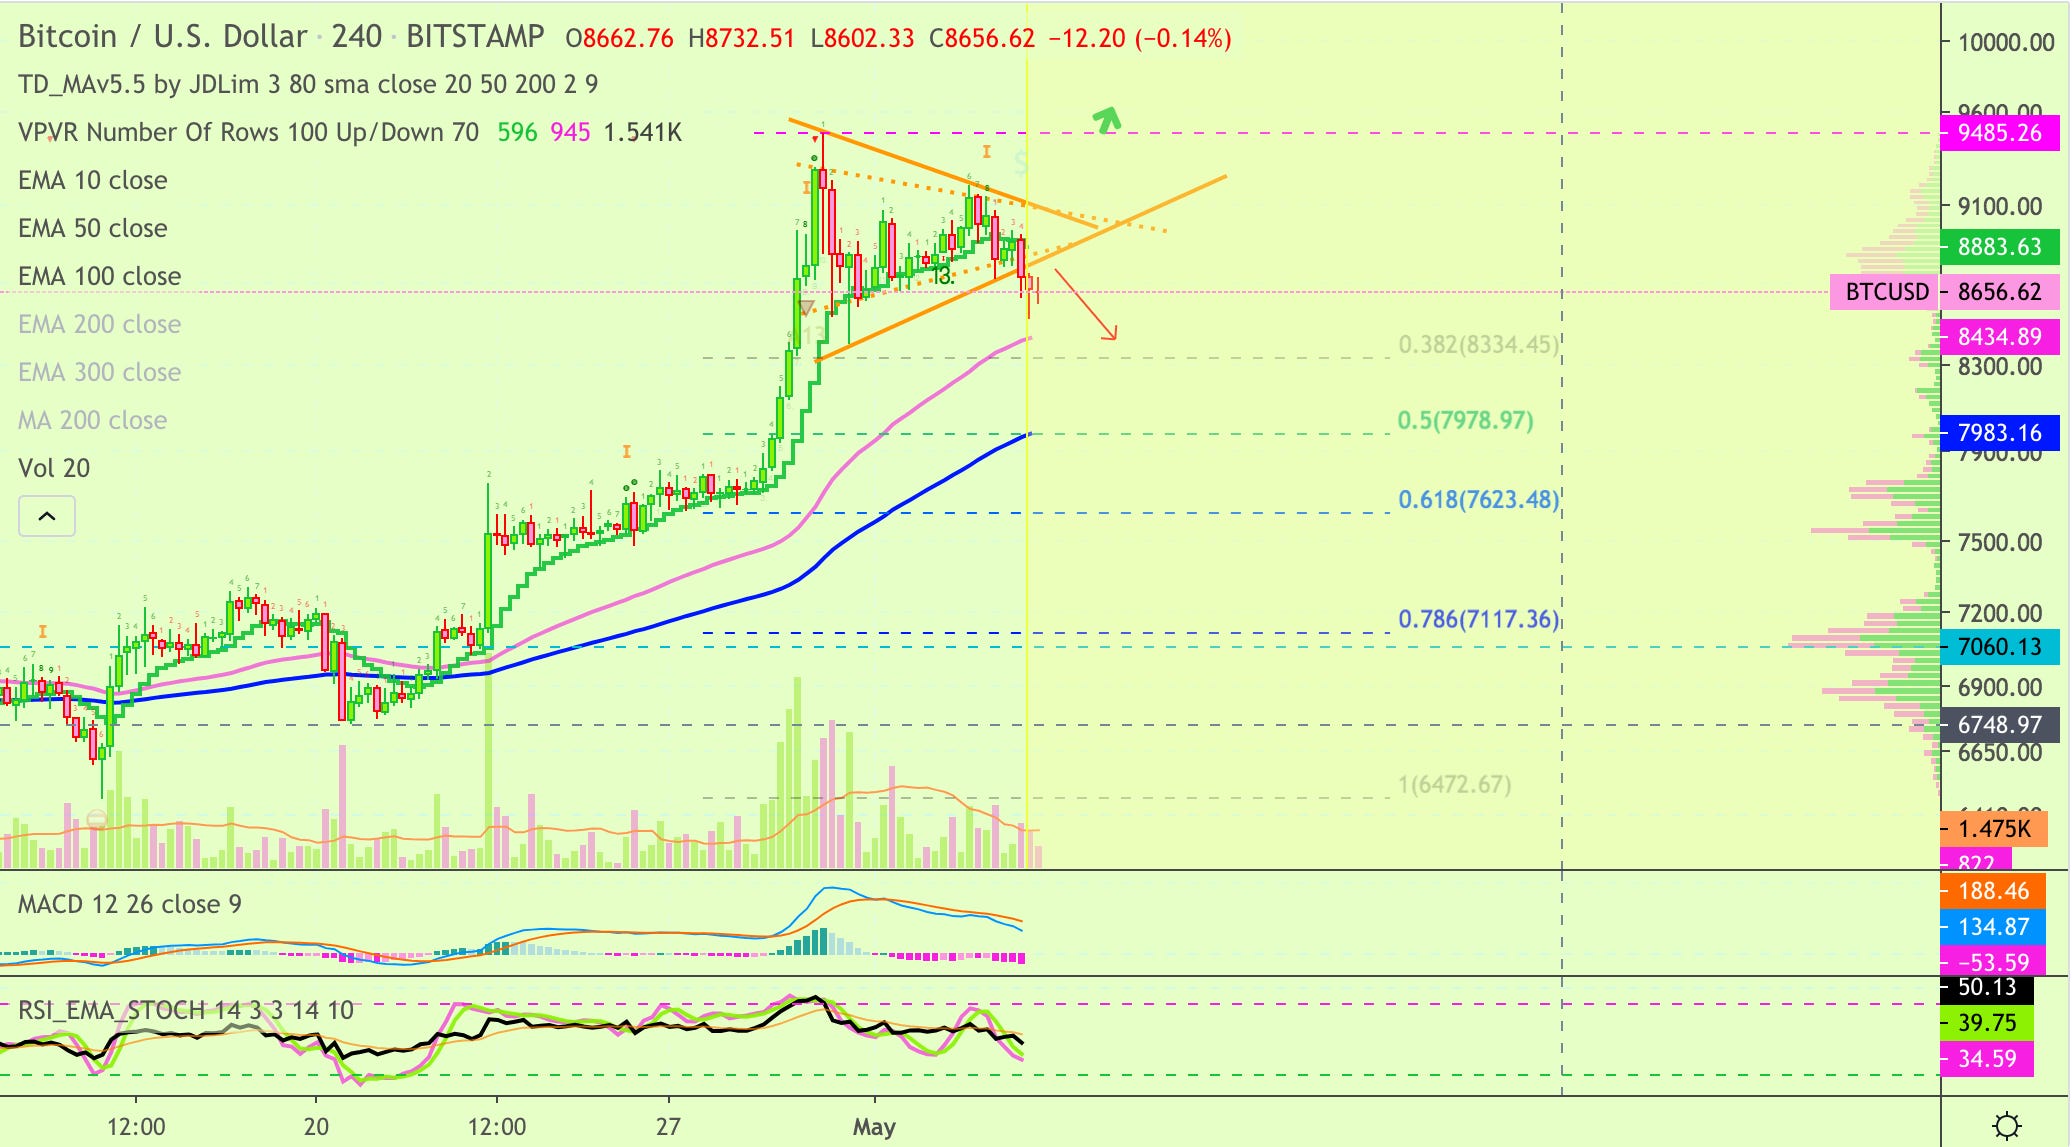
4hr timeframe & the bearish bias
Something is also brewing on the 4H timeframe and the bearish bias is gaining a bit of momentum now.
The prices have broken below EMA10 with the next target sitting at $8334 or EMA50.
It is still a bit early to call this drop as the trading volume is still low but we are likely to see sub EMA50 price before a leg in the upward direction.
https://www.tradingview.com/chart/BTCUSD/G48AzV2C-Bitcoin-Support-Levels-4H-Timeframe/
AAaannnd that’s a wrap for today! Please always keep in mind that absolutely NO part of this write-up is trading advice and you should always trade at your own risk. If you would like to receive more charts directly to your inbox signup using the below link, till then please share and subscribe to our newsletter and happy trading!